Supplemental Coverage Option for 2019 Crops

Contributed by Steve JohnsonFarm Management Specialist, Iowa State University Extension and Outreach, sdjohns@iastate.edu

Headshot of Steve JohnsonSupplemental Coverage Option (SCO) crop insurance was introduced in the 2014 Farm Bill but was limited to acres enrolled in the Price Loss Coverage (PLC) commodity program. SCO was not available when Agricultural Risk Coverage (ARC) was chosen by crop by FSA farm number. ARC was the choice for nearly 98 percent of the Iowa’s base corn acres and over 99 percent of the base soybean acres from 2014 through 2018.

As a result, SCO was not a crop insurance choice for very many farms through 2018. Similar to the 2014 Farm Bill the 2018 Farm Bill again gives farmers a choice by crop by FSA farm number to elect and enroll in either the ARC-County or the PLC program.

However, with the 2018 Farm Bill being implemented in 2019, the expectation of some experts is that many farmers will eventually enroll in the PLC program for the 2019 and 2020 crop years, especially on their corn base acres. That’s because of the potential for the PLC program to trigger payments should the final national average cash price fall below the $3.70 per bushel reference price. Enrollment in PLC will lead to more insured crop acres being eligible for the purchase of SCO. For 2019, SCO premiums appear very attractive as compared to Revenue Protection (RP) at higher coverage levels.

Coverage based on county revenue

The SCO band of coverage will be based on the county revenue given that the underlying crop insurance product is RP. SCO provides a protection in a band at an 86 percent maximum level down to the coverage level selected for RP. An example would be a farmer who selects a 75 percent coverage level for RP in addition to the SCO product. Thus, SCO could provide county-based revenue coverage from the 86 percent to the 75 percent level.

To trigger an indemnity claim, a county-based revenue must fall below 86 percent of expected revenue before SCO makes a payment. As a result, the RP-SCO combination provides mixed coverage: Farm-level coverage is provided from the RP product downward while county-level coverage provides between 86 percent and the coverage level of the RP product.

The primary disadvantage of the RP-SCO combination is that the county-level coverage may not match losses on a farm. Sometimes a farm may have a loss while SCO will not trigger a payment. It’s also possible for the farm to not have a loss while the county-based SCO product triggers a payment.

Premiums under RP-SCO combinations

The primary advantage of using SCO is a lower farmer-paid premium. The costs of an RP-SCO combination product will usually be lower than the 85 percent RP product alone for two reasons.

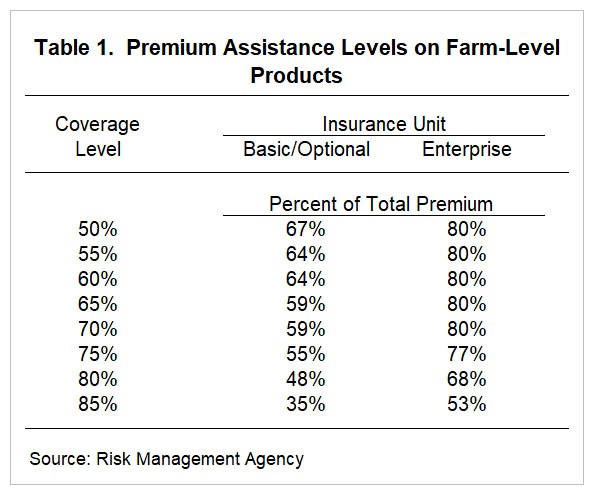
First, the county yields are typically less variable than the farm yields, resulting in fewer payments for a county-based product than for a farm-level product at the same coverage level. Lower payments then result in a lower premium. Second, SCO has a subsidy rate of 65 percent which is a higher than the RP at the 85 percent coverage levels using enterprise units. This 65 percent subsidy rate is higher than all subsidy levels for basic and optional units when the coverage level is above 50 percent. These government paid premiums are reflected in Table 1 below.

table showing premium assistance levels on farm-level products

Who should consider SCO?

Farmers who typically purchase RP at high coverage levels could find SCO useful, particularly if a lower coverage level is selected that might result in a lower farmer-paid premium. However, the farmer should have the intention of eventually electing and enrolling those crops on those farms in the PLC program. Farmers interested in SCO coverage for 2019 should discuss premiums and choices with their crop insurance agent before the March 15 sales closing deadline on spring planted crops.

Ag Decision Maker (AgDM) 

An agricultural economics and business website.

Why it is not OK to use NASS yields to calculate ARC-CO payments

plastina_alejandro_2014Alejandro Plastina, ISU Extension Economist, provides explanation of the yield data used in calculating ARC-CO payments in Iowa.

On February 22 2016, the USDA National Agricultural Statistical Service (NASS) released the final county crop production estimates for 2015: 73 Iowa counties had higher corn yields in 2015 than in 2014, 22 had lower yields, and 2015 corn yields were not reported for Mills, Monroe, Taylor, and Union County; 86 counties had higher soybean yields, 11 had lower yields, and 2015 soybean yields were not reported for Taylor and Mills County.

Knowing that higher county yields reduce the likelihood and the potential amount of ARC-CO payments, the NASS release spurred the interest of producers to recalculate their own projected ARC-CO payments for the 2015/16 crop marketing year. However, two important details often overlooked when calculating projected ARC-CO payments are (1) that county yields are determined on a per planted acre basis, as opposed to a per harvested acre basis; and (2) that the official county yields used in the final calculation of ARC-CO payments are published by USDA Farm Service Agency (FSA), as opposed to NASS.

NASS yields are calculated as production (in bushels) divided by harvested acres. Since they are not determined on a per planted acre basis, they cannot be used to calculate ARC-CO payments.

FSA yields are only available after the end of the crop year and are calculated on a per planted acre basis. Therefore, most of the difference between FSA and NASS yields is explained by failed acres. The average difference between FSA and NASS county corn yields in Iowa for 2014/15 (the only year for which both yields are publicly available), amounts to 4.75 bushels per acre.

arcco3232016In an effort to reflect the impact of failed acres on the yield used to project ARC-CO payments, the ISU Projected ARC-CO Payment Calculator uses “corrected” yields in the calculation of the 2015/16 actual county crop revenue. The “corrected” yields are based on NASS production data and obtained by dividing production (in bushels) by planted acres. For 63 Iowa counties the “corrected” yields in 2014/15 were closer to the official FSA yields than NASS yields were. For example, the corn yield used by FSA to calculate ARC-CO payments for Lyon County in 2014/15 is 149 bushels, while the NASS yield is 172.9 bushels, and the “corrected” yield is 155 bushels. The average difference between FSA and “corrected” corn yields amounted to 0.42 bushels per acre.

Judging by the release date of 2014 county yields by FSA on October 23, 2015, it can be expected that FSA will release final 2015 county yields in October 2016, at about the same time as the 2015 ARC-CO payments. Until then, the ISU ARC-CO Payment Calculator will use a “calculated” yield and projected marketing year price until the price for the marketing year is finalized the end of September.

All ISU Extension and Outreach Farm Bill decision tools are available online at: http://www.extension.iastate.edu/agdm/info/farmbill.html

Ag Decision Maker (AgDM) 

An agricultural economics and business website.

Worksheet Helps Producers Identify Selections for 2014 Farm Bill

The Agricultural Act of 2014 is important legislation. It provides farmland owners and operators the opportunity to make a one-time election of a commodity program for 2014 through 2018. The legislation also allows the operator to enroll annually in a chosen program. Iowa State University Extension and Outreach provides several resources to assist in this decision-making process.

“While the Farm Bill of 2014 provides opportunities for farmers to update their farm selections, it is important that they consider several factors before making these decisions,” said Ann Johanns, extension program specialist. Johanns coordinates Ag Decision Maker, an agricultural economics and business website sponsored by Iowa State University Extension and Outreach.

“We have developed several tools, including the Base Acreage Reallocation and Payment Yield Update, to assist owners and operators as they determine what is best for their business and family,” Johanns said.

Alejandro Plastina, an extension economist with Iowa State University Extension and Outreach, developed the Base Acreage Reallocation and Payment Yield Update.

“Opportunities to update base acres and payment yields for commodity programs are few and far between,” Plastina said. “So farmers should seriously consider this opportunity provided by the 2014 Farm Bill.”

“The worksheet is a simple tool to evaluate the convenience of having the payment formulas for some commodity programs updated to better reflect current production patterns on a farm-by-farm basis,” Plastina added. He noted that the decision tool includes multiple worksheets to allow information for up to five farms.

The Base Acreage Reallocation and Payment Yield Update worksheet was designed to help Iowa farmland owners with base acreage reallocation decisions for the Agricultural Risk Coverage-County (ARC-CO) program and the Price Loss Coverage (PLC) program, and with payment yield update decisions for the PLC program. To access this and other online tools, go to www.extension.iastate.edu/agdm.

To further support producers, a series of workshops will be held across Iowa to provide information about the Farm Bill and the impact it has on producers. The meetings will be held once final regulations are set. A complete schedule will be posted on the AgDM Farm Bill Web page at www.extension.iastate.edu/agdm/info/farmbill.html.

Ag Decision Maker (AgDM) 

An agricultural economics and business website.

Ag Decision Maker text image

Archives