Alejandro Plastina, extension economist, explores results of a follow-up survey on the accuracy and usefulness of the ISU Cash Rental Rate Survey.
 Cash rents, land values, and rates for custom work in Iowa are topics that usually attract lots of attention from a number of stakeholders in the agricultural sector. Even more so when the economic outlook for the sector is particularly promising or particularly discouraging. So it comes as no surprise that the Cash Rental Rates for Iowa Survey is received with different degrees of acceptance by different groups depending on the economic outlook. This year we requested feedback from the online respondents to the Cash Rent Survey about the accuracy and usefulness of the survey results.
Who responded?
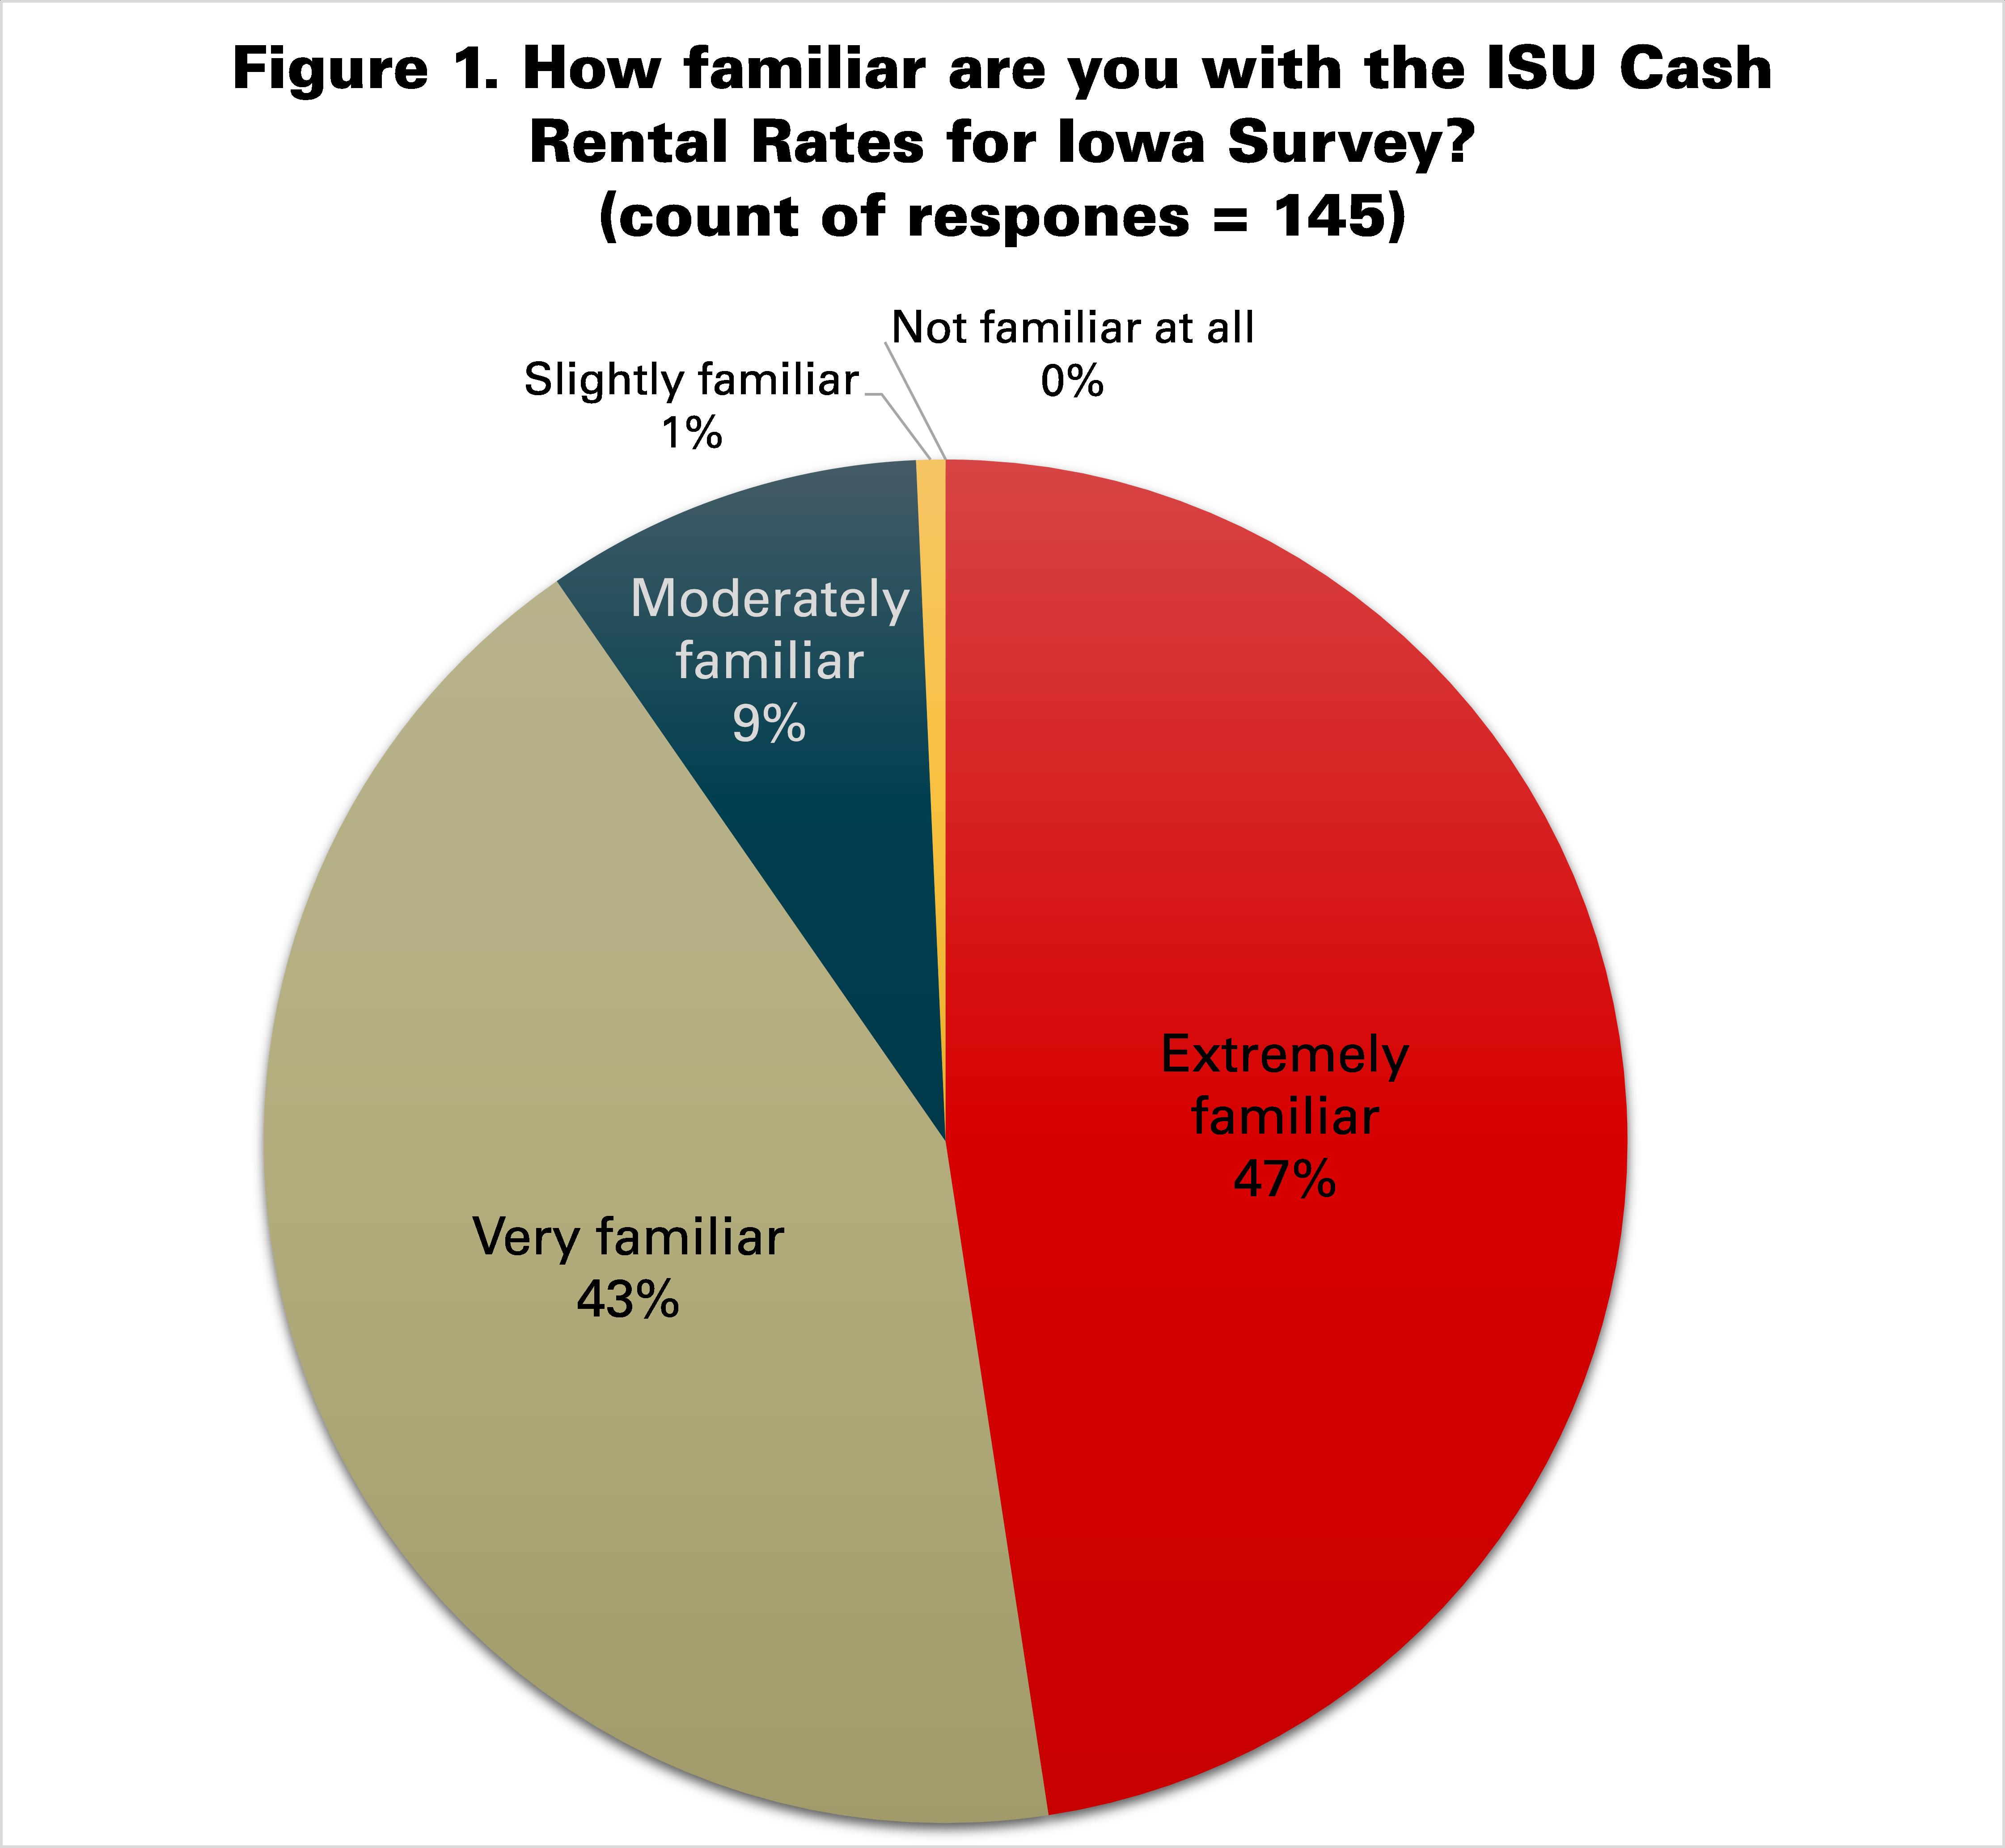
The Cash Rental Rates for Iowa 2016 Survey had 1,585 responses, of which 320 responses were submitted through the online questionnaire (the rest were mailed using USPS). All online respondents were invited to participate in a short follow up survey about their perceptions of the Cash Rent Survey. One hundred and forty-five respondents completed the follow up survey. All of them reported being familiar with the survey (figure 1).
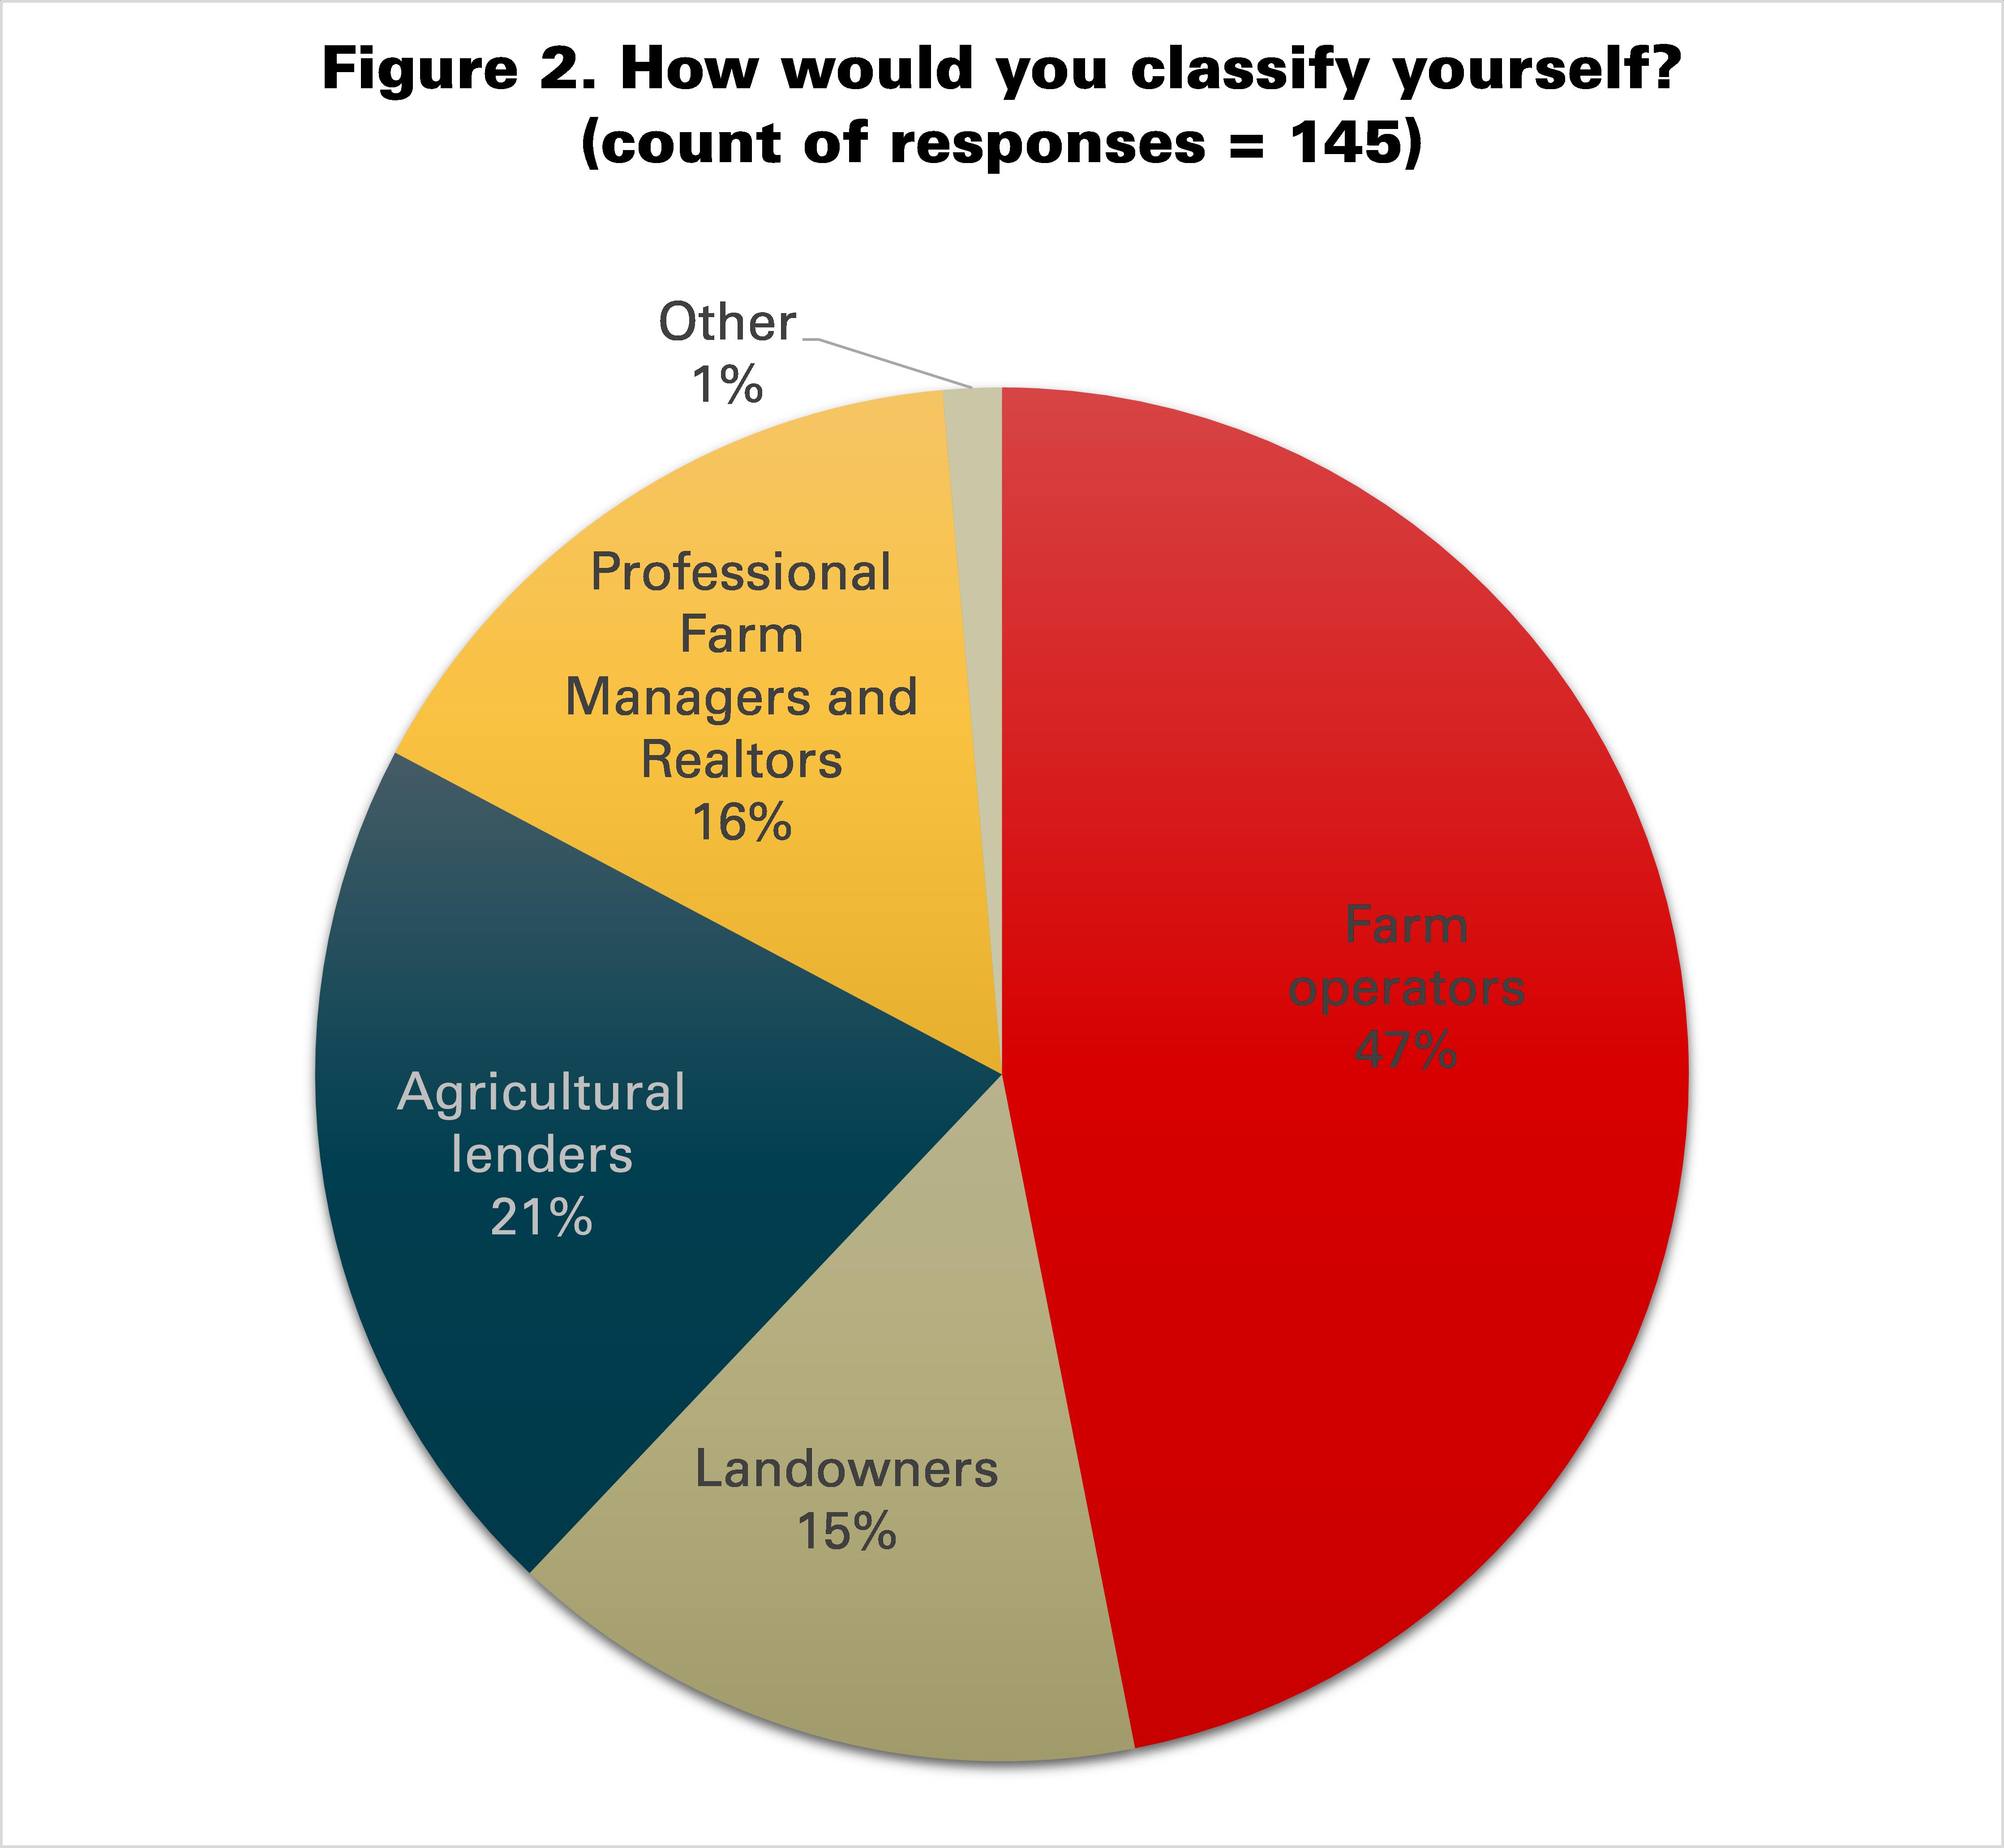
Comparing the participation of different categories of participants in this opinion poll versus the corresponding participation of the same categories in the Cash Rent Survey (figure 2), farm operators accounted for the same share (47%); but agricultural lenders, professional farm managers and Realtors had a greater share (21% vs. 14%, and 16% vs. 12%, respectively); while landowners had a smaller share (15% vs. 25%).


How accurate are survey results?
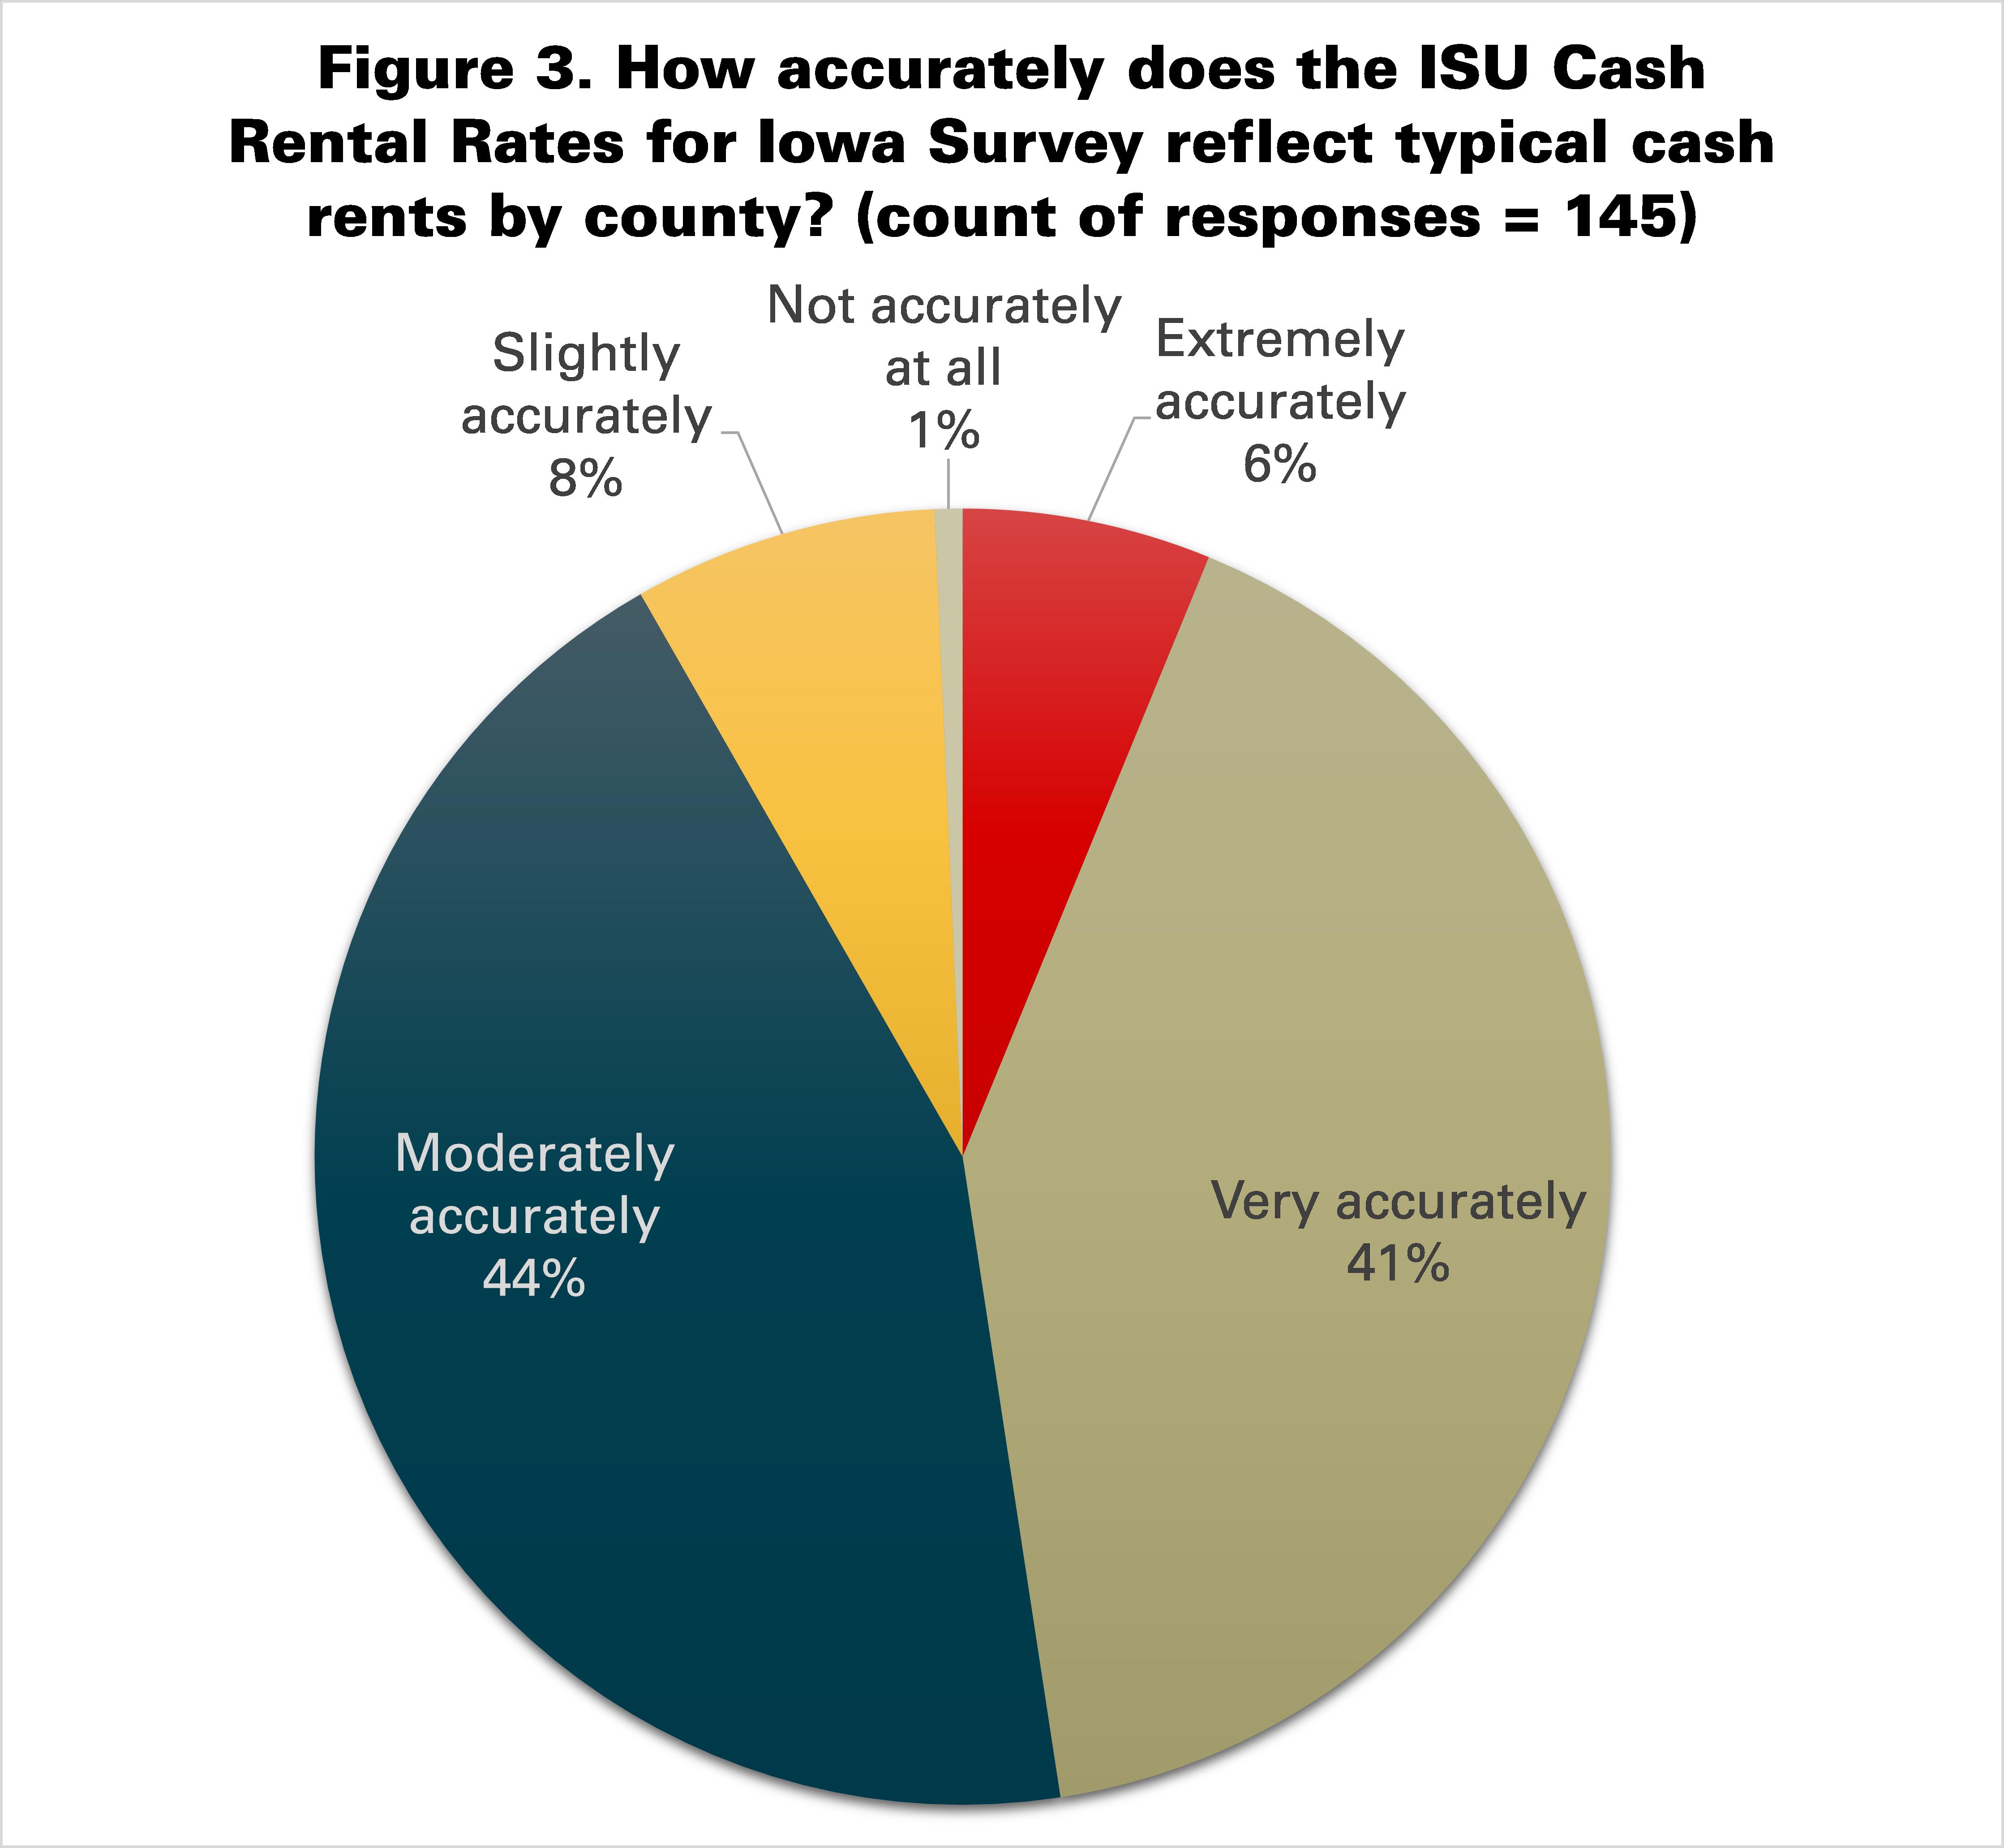
Ninety-one percent of the respondents indicated that the Cash Rent Survey reflects typical cash rents by county moderately, very, or extremely accurately (figure 3). Forty-seven percent of the respondents indicated that the Cash Rent Survey reflects typical cash rents by county very or extremely accurately.
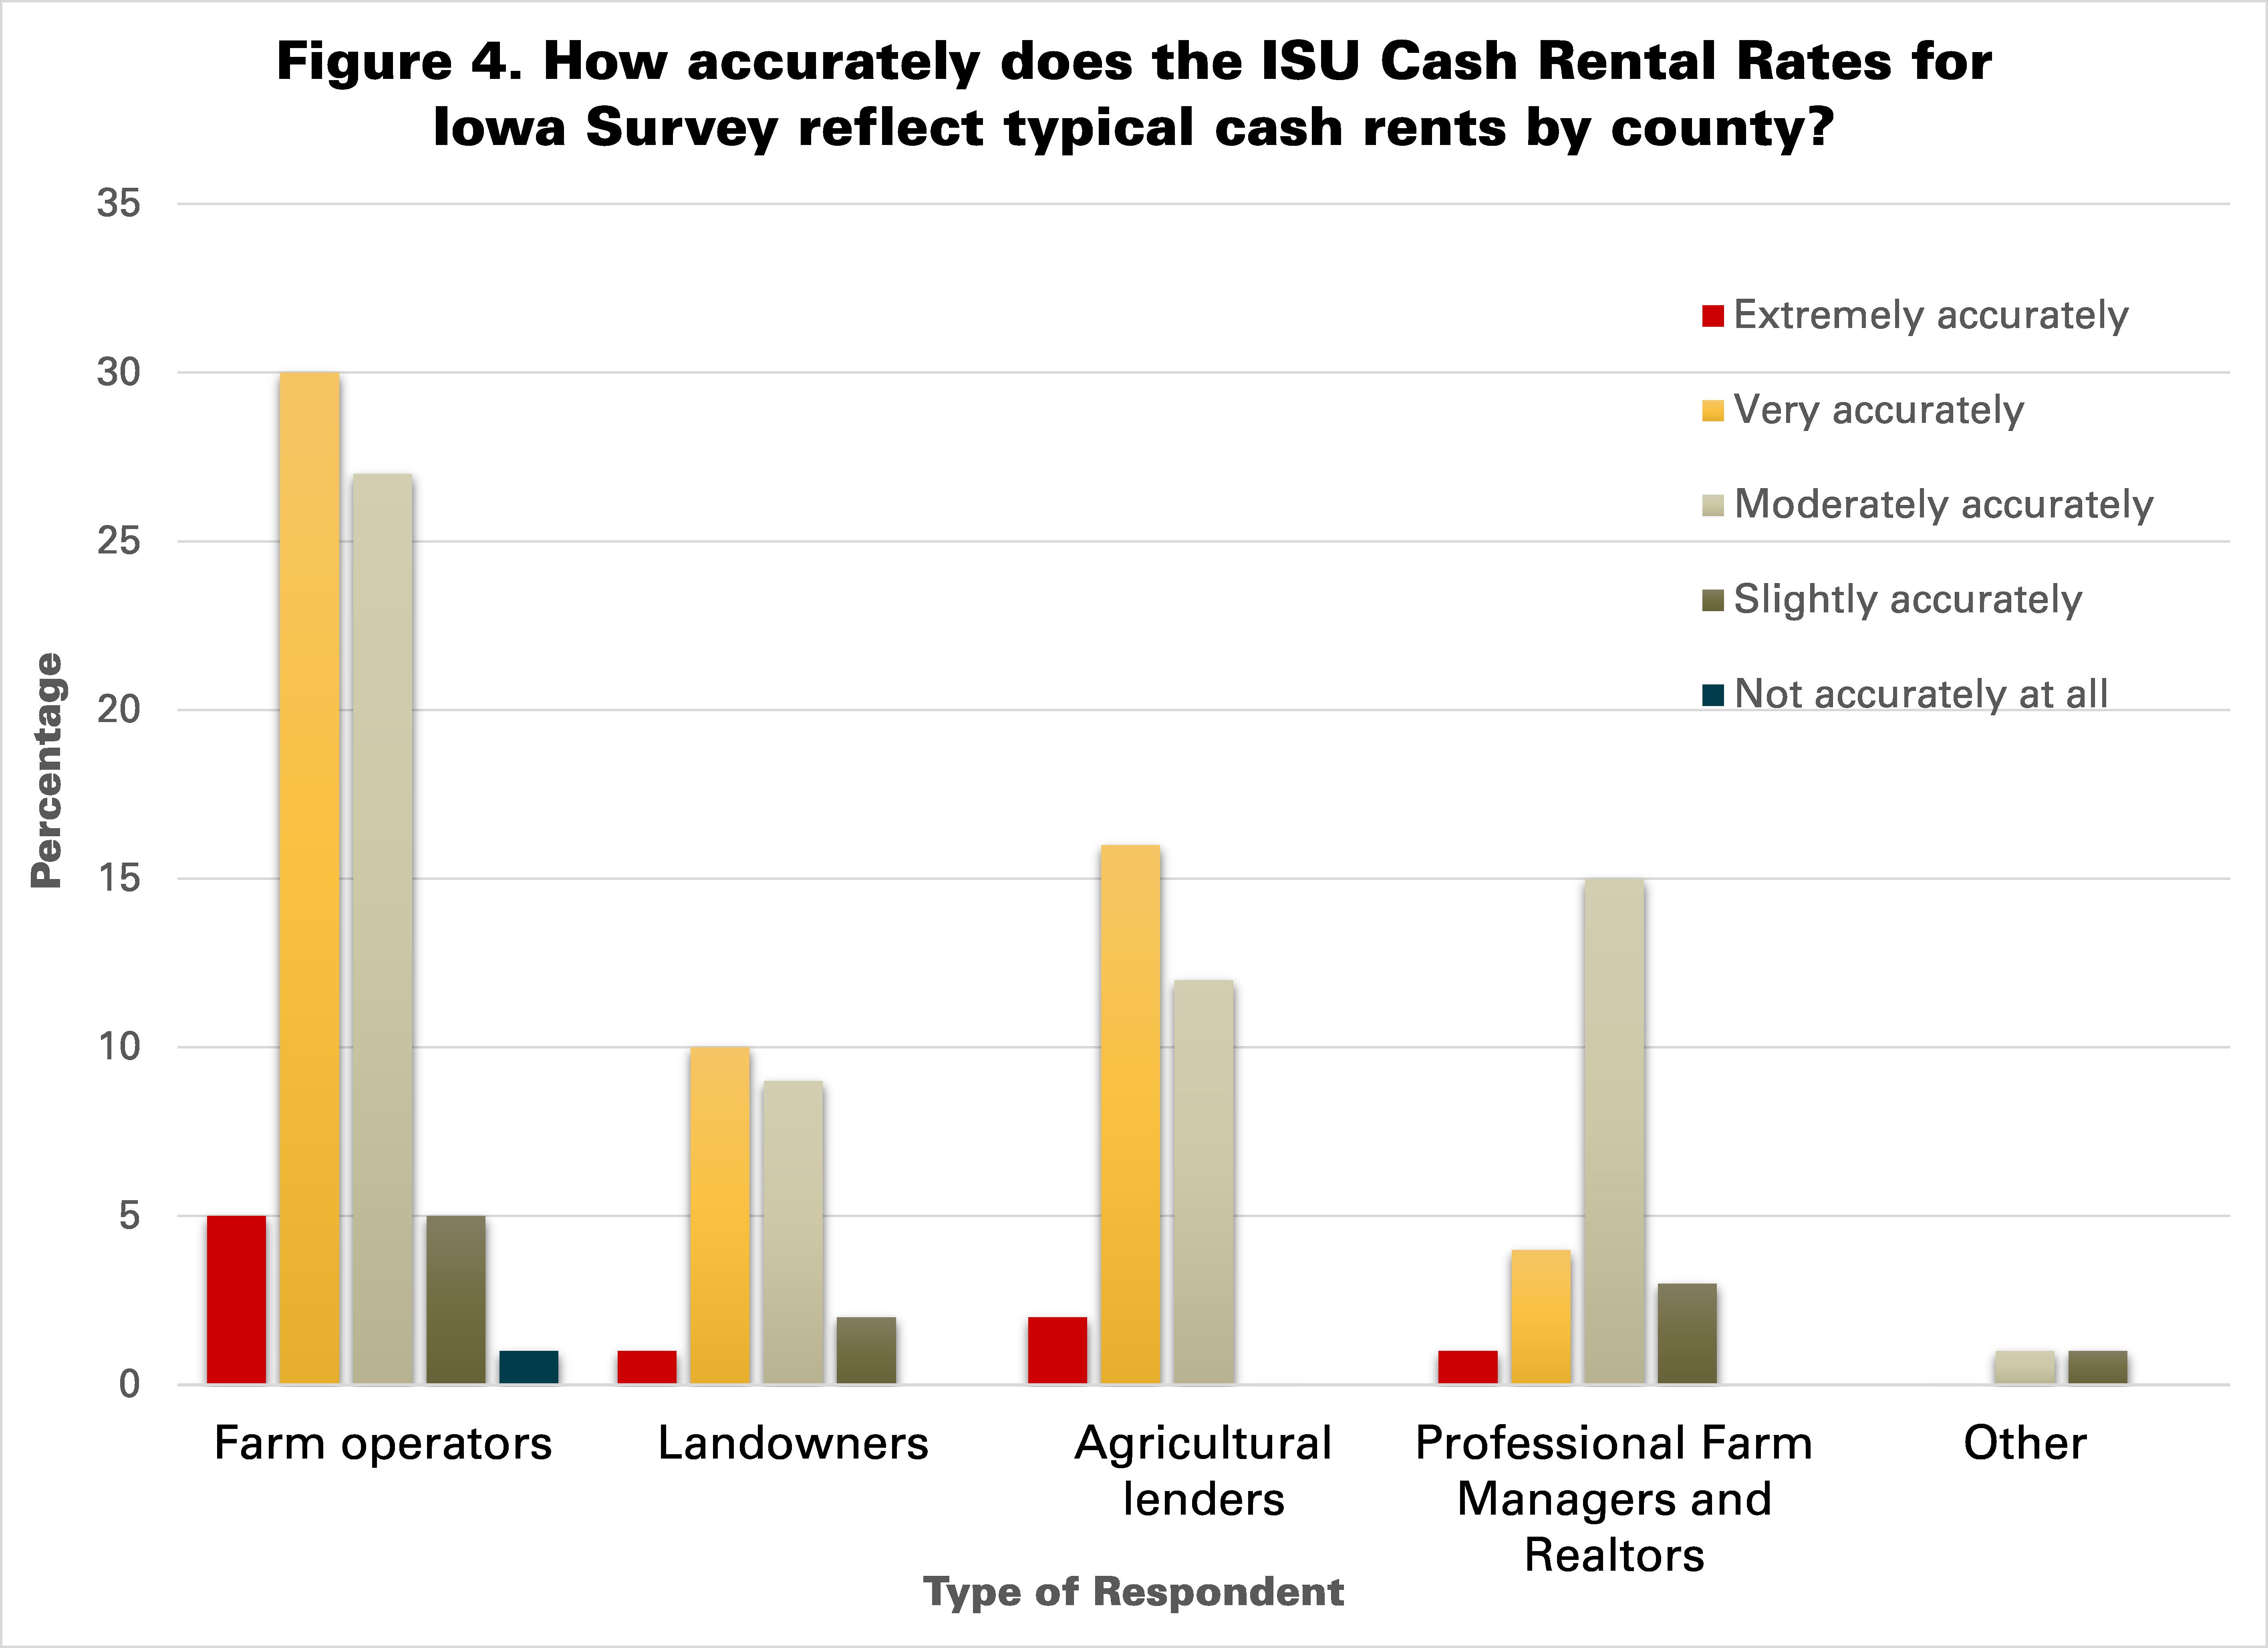
The most prevalent response among farm operators, landowners, and agricultural lenders was that the Cash Rent Survey reflects typical cash rents by county very accurately, followed closely by moderately accurately (figure 4). The most prevalent response among professional farm managers and Realtors was that the Cash Rent Survey reflects typical cash rents by county moderately accurately.


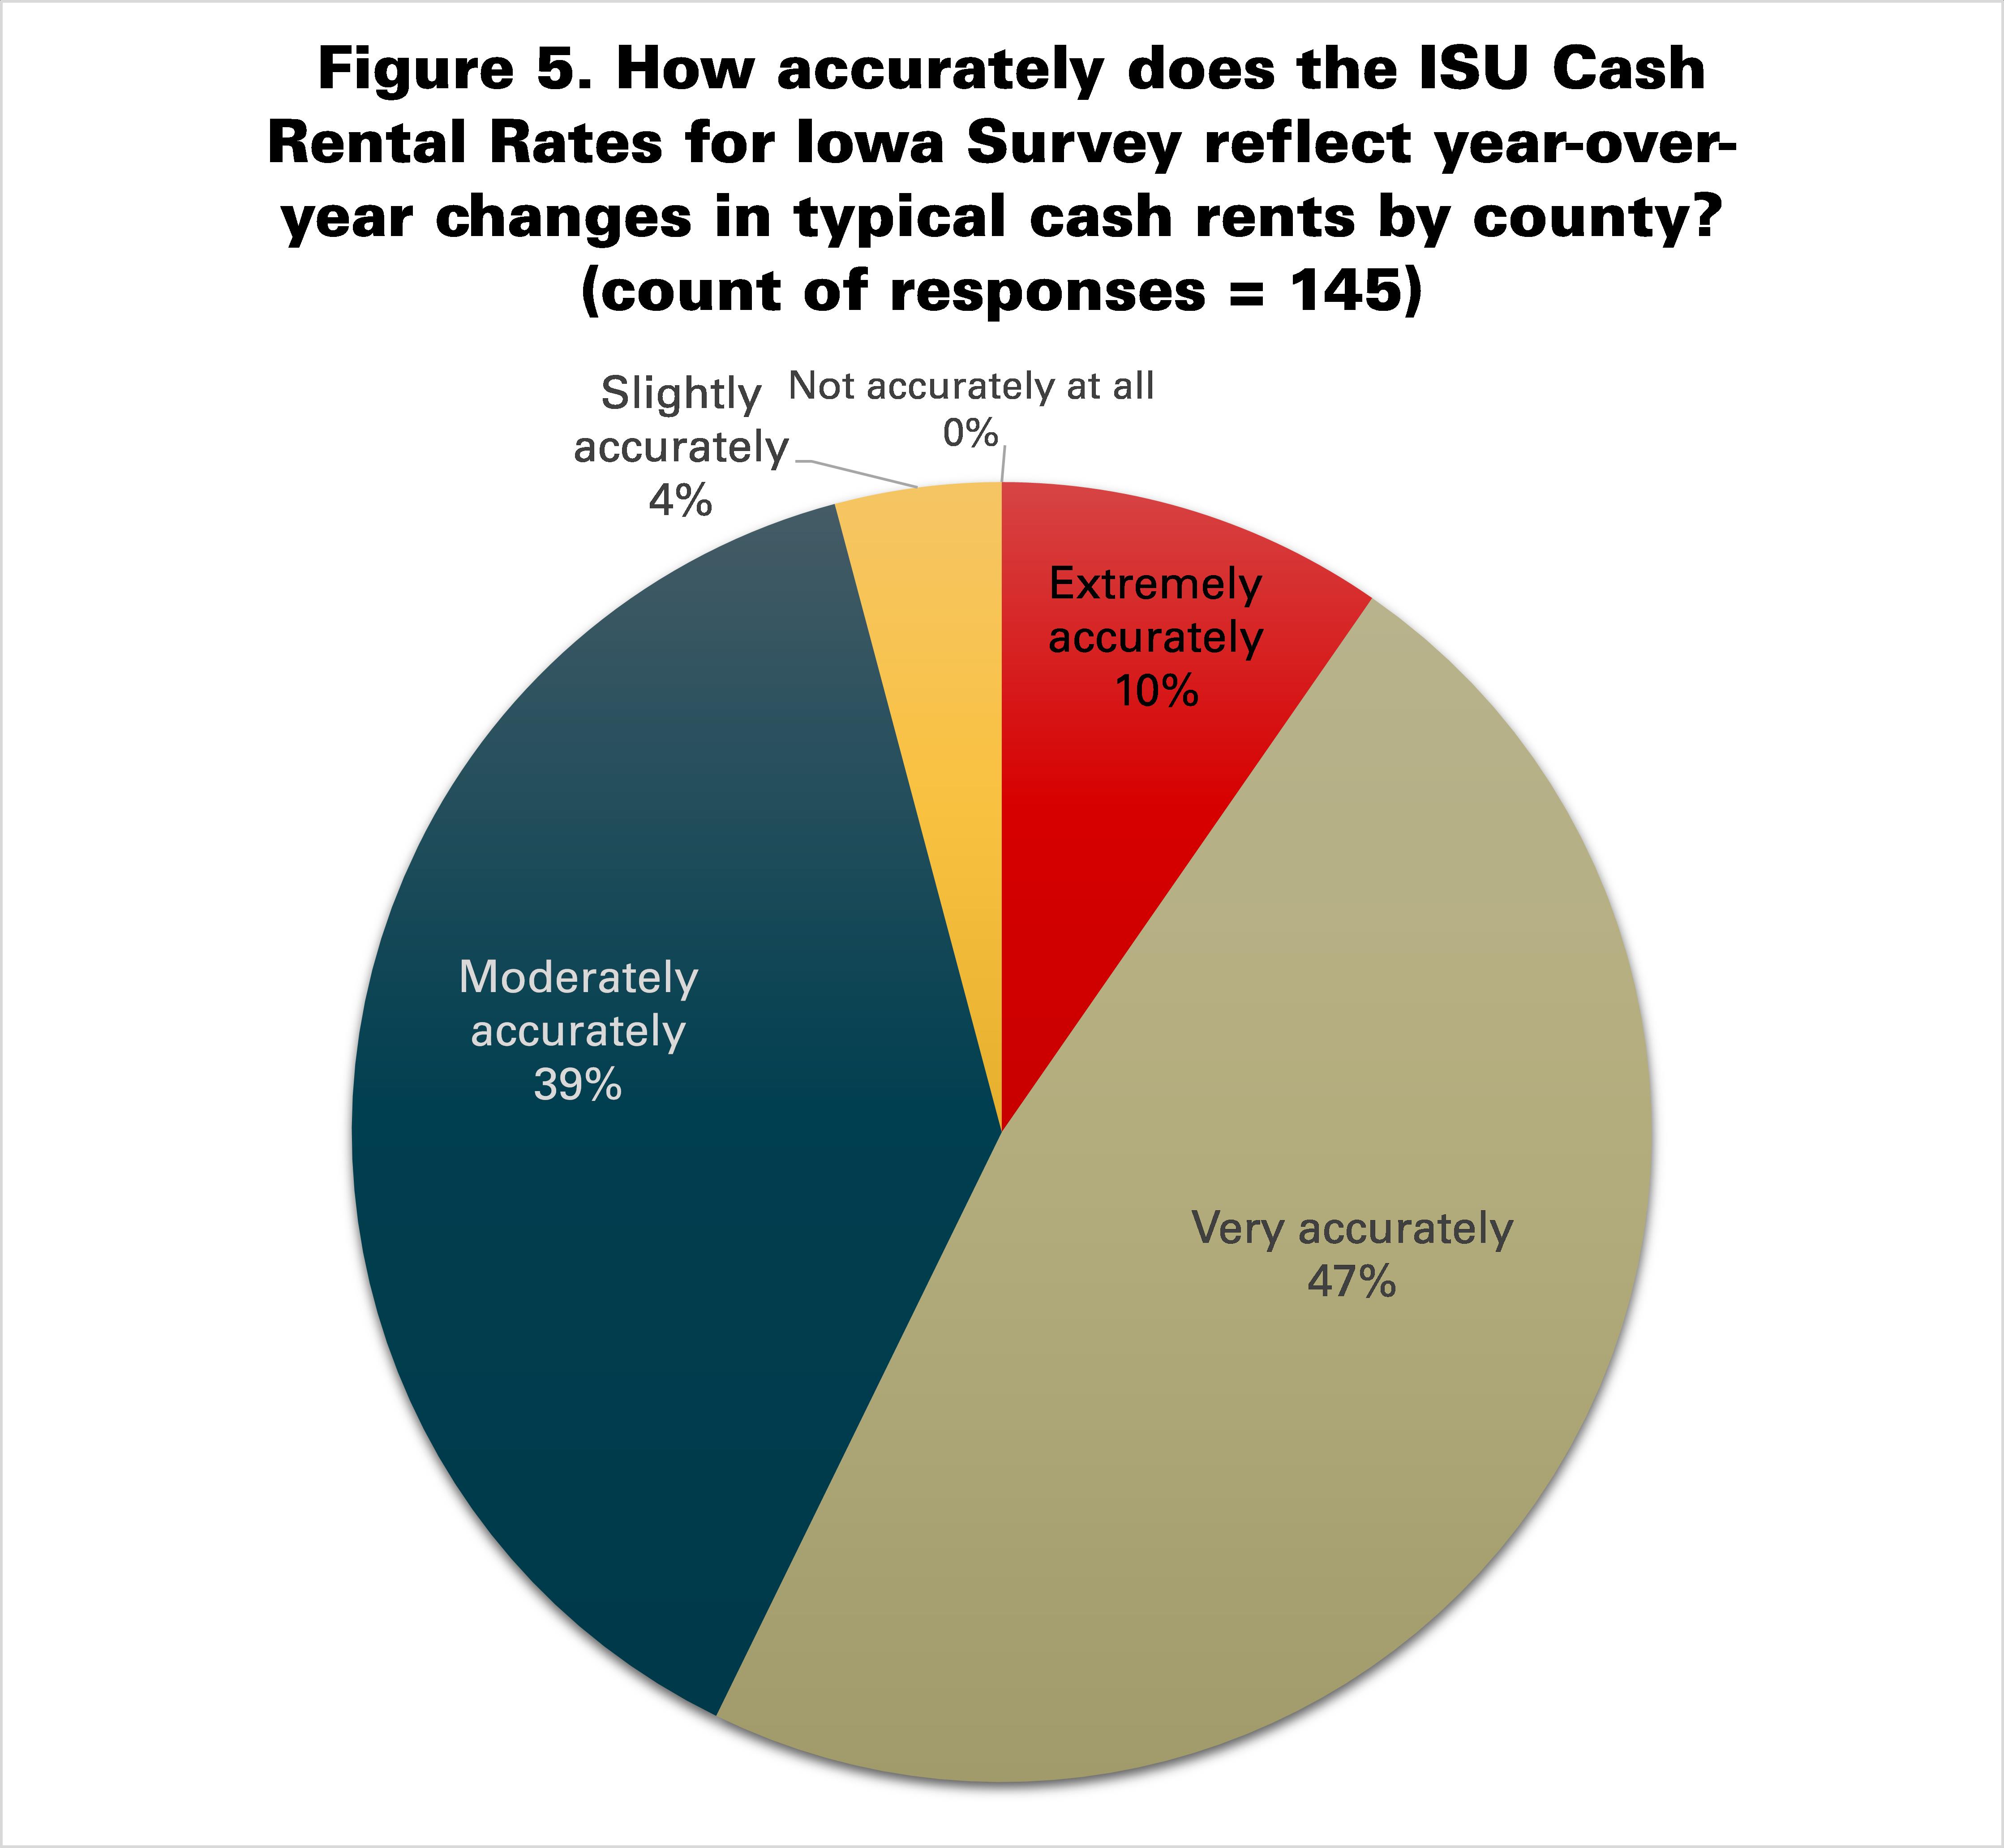
The accuracy of the Cash Rent Survey in reflecting annual changes in typical cash rents by county was perceived to be better than the accuracy in reflecting their levels. Ninety-six percent of the respondent indicated that the Cash Rent Survey reflects year-over-year changes in typical cash rents by county moderately, very, or extremely accurately (figure 5). Fifty-seven percent indicated that the Cash Rent Survey reflects year-over-year changes in typical cash rents by county very or extremely accurately.
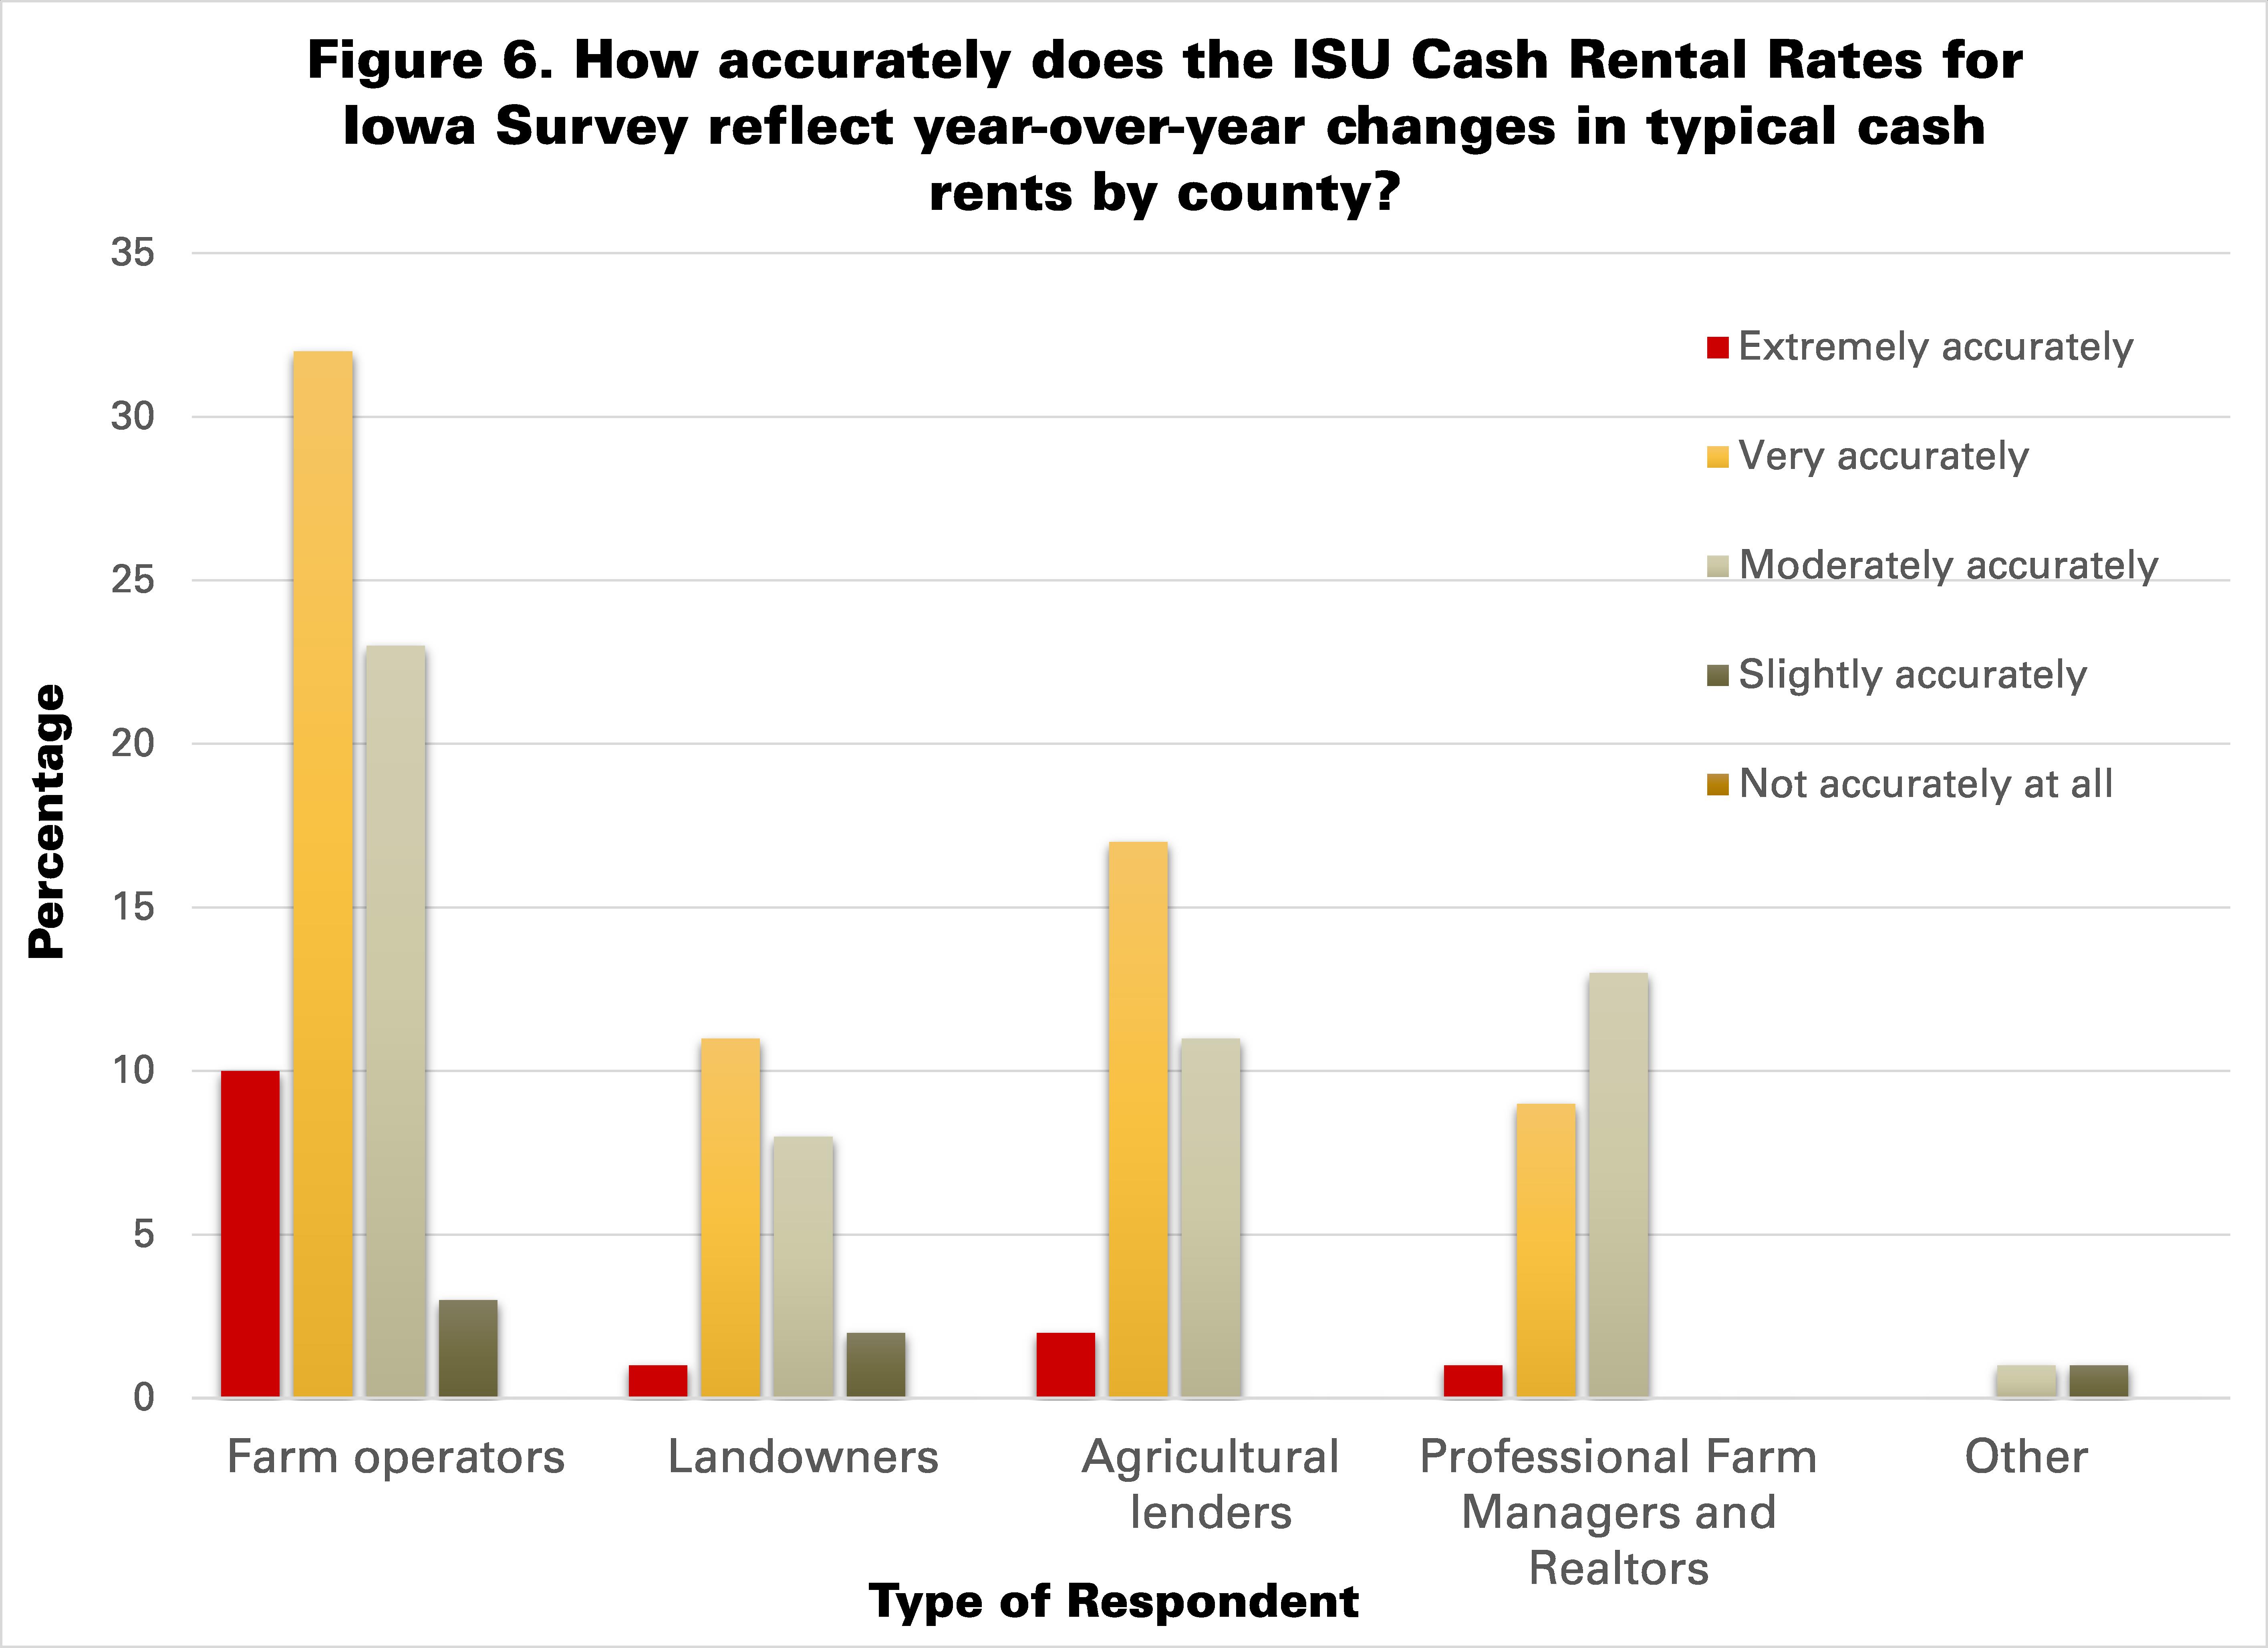
The most prevalent response among farm operators, landowners, and agricultural lenders was that the Cash Rent Survey reflects typical cash rents by county very accurately, followed by moderately accurately (figure 6). The most prevalent response among professional farm managers and Realtors was that the Cash Rent Survey reflects typical cash rents by county moderately accurately, followed by very accurately as a close second.


How useful are survey results?
Ninety-seven percent of the respondents indicated that the Cash Rent Survey was at least moderately useful to them (figure 7). Seventy-six percent of the respondents indicated that the Cash Rent Survey was very or extremely useful to them.
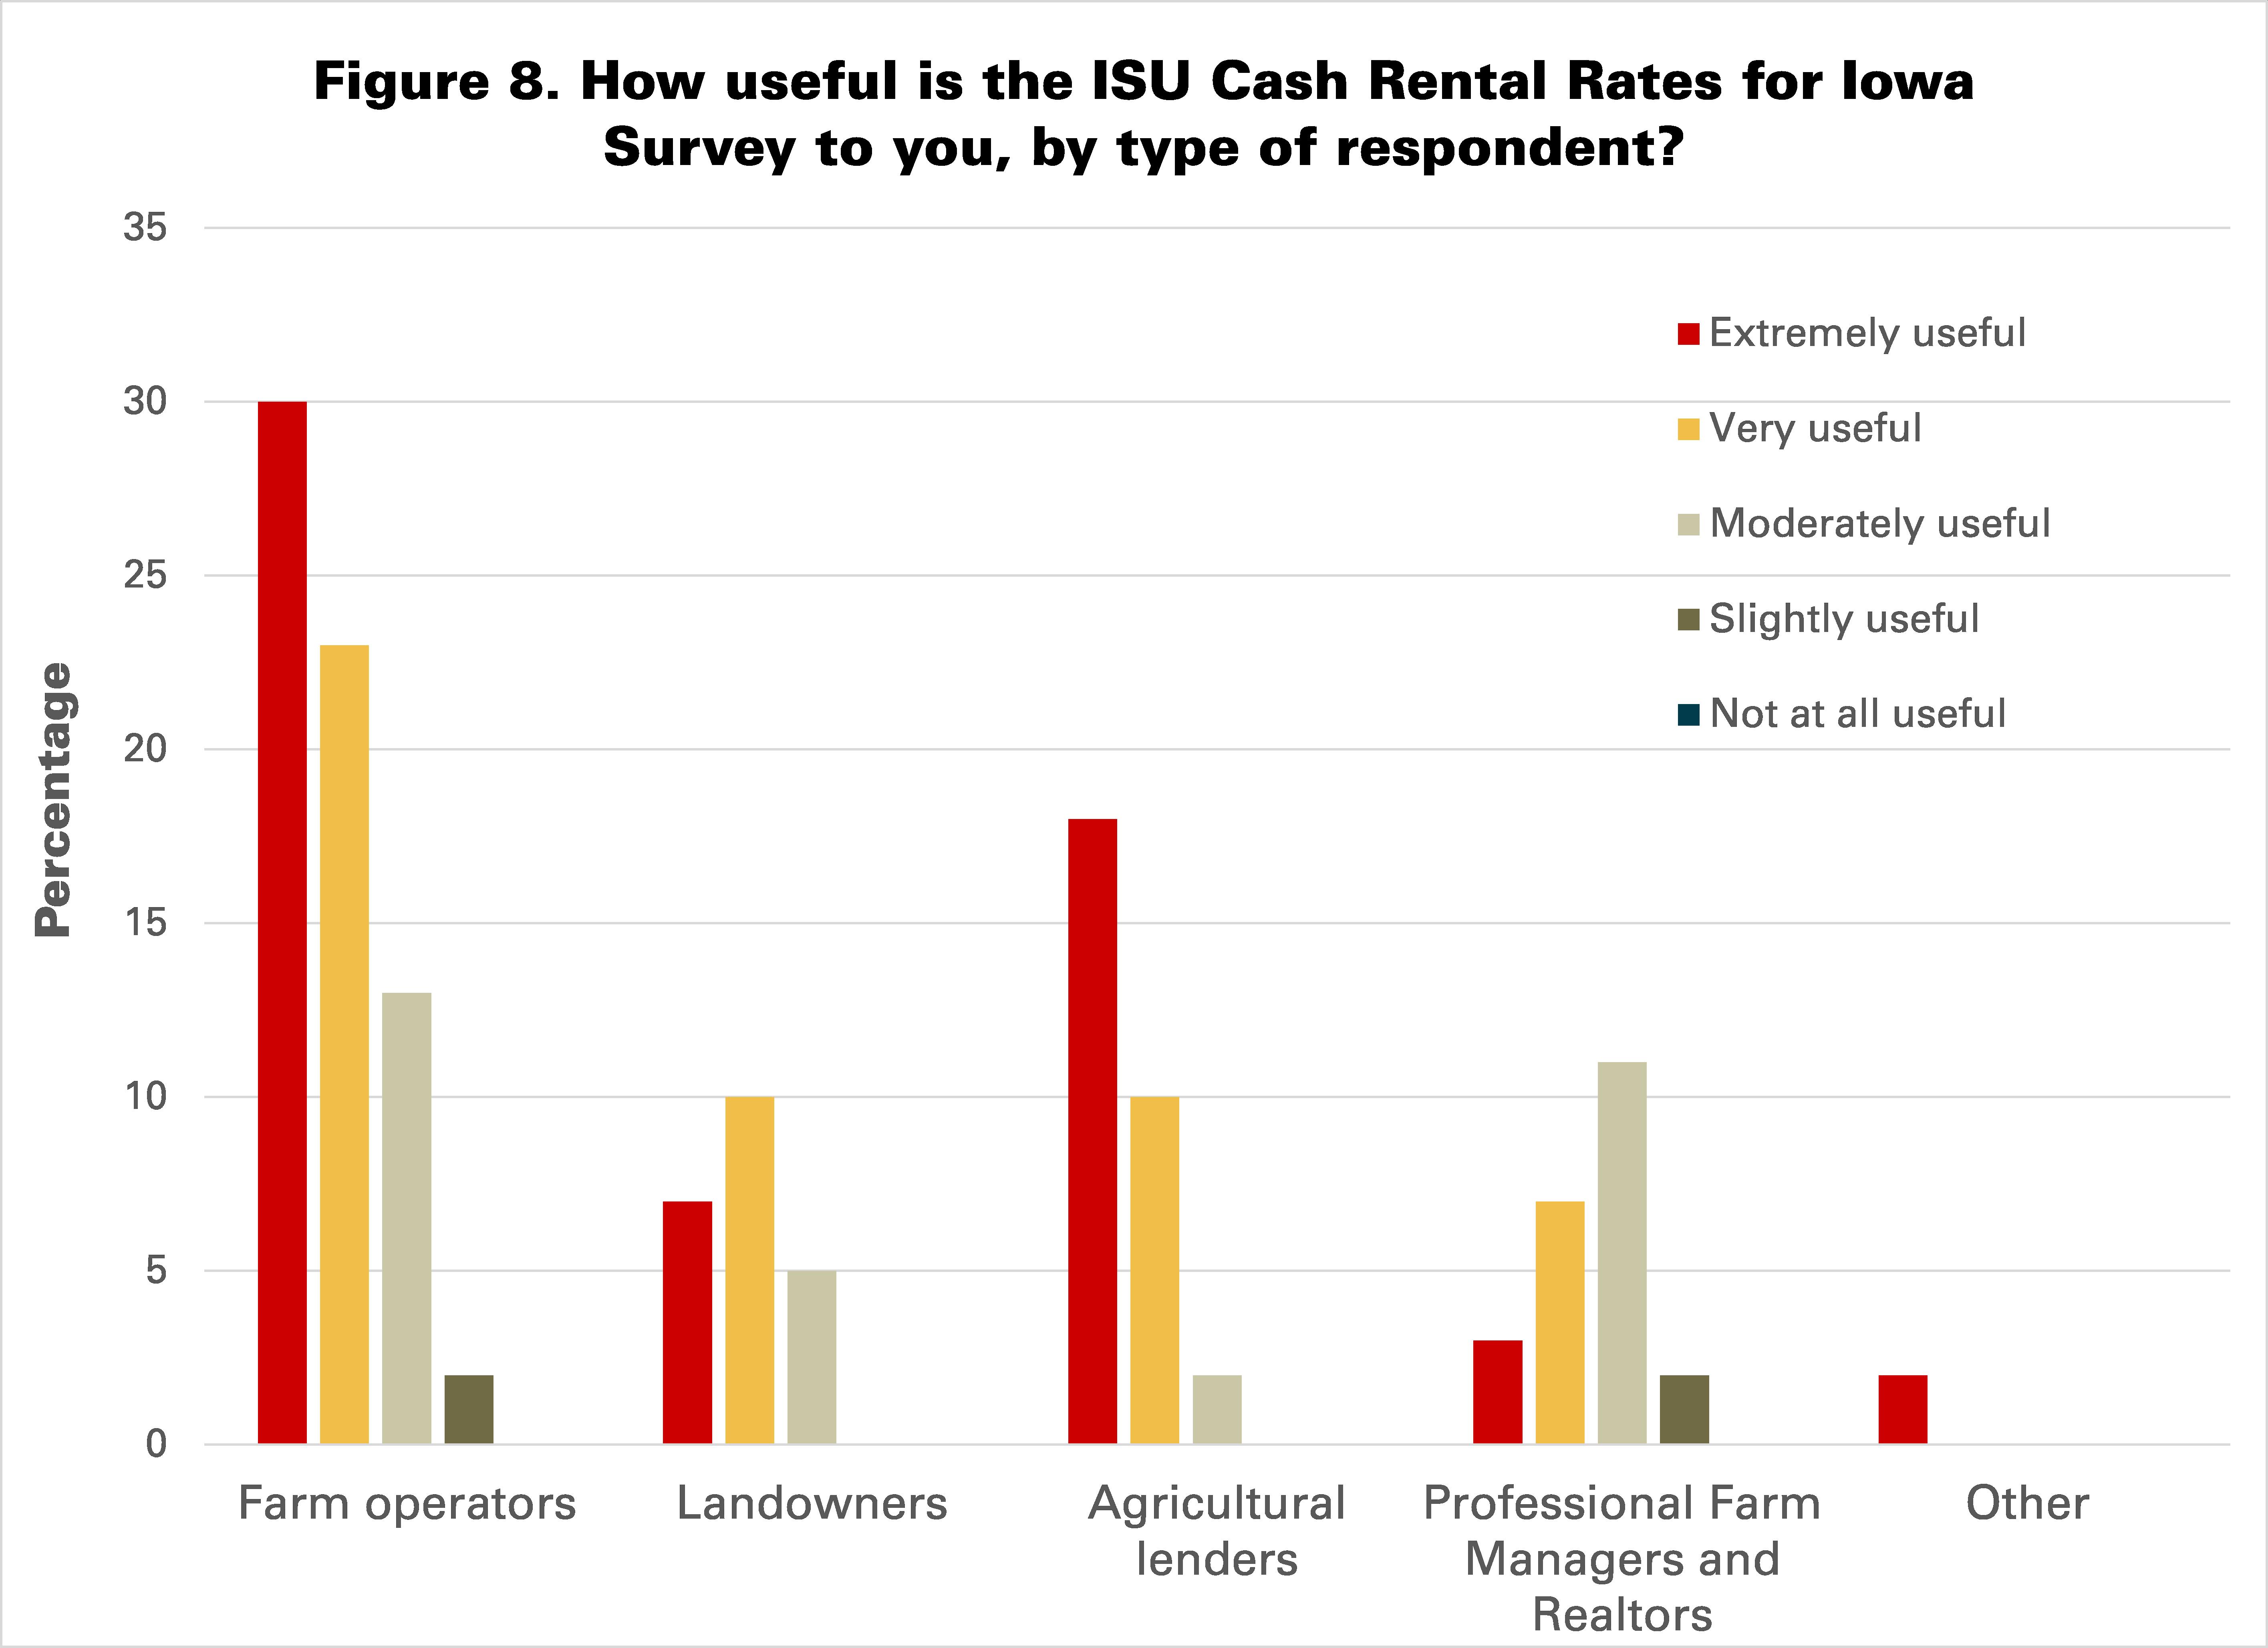
The most frequent answer among farm operators and agricultural lenders was that the Cash Rent Survey was extremely useful, followed by very useful and in a distant third place moderately useful (figure 8).
The most frequent answer among landowners was that the Cash Rent Survey was very useful, followed by extremely and moderately useful.
Professional managers and Realtors indicated most frequently that the Cash Rent Survey was moderately useful, followed by very and extremely useful.


Summary
Although this opinion poll about the usefulness and accuracy of the Cash Rental Rates for Iowa Survey was not designed to be representative of all stakeholders in Iowa, it shows that most farmers, landowners, agricultural lenders, professional farm managers and Realtors, and other agricultural professionals that participate in the survey find it useful and accurate.
An agricultural economics and business website.